Changing the colours or type of chart or graph
nowBI
15/8/2024 11:24
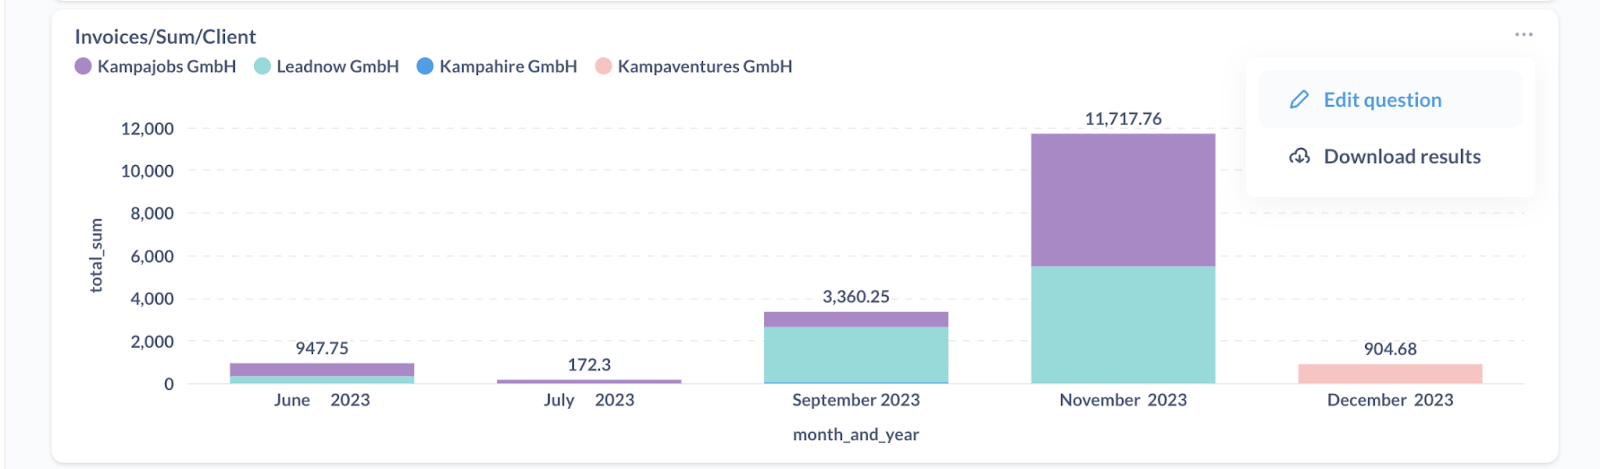
- Click the three dots in the upper right corner of any of the visual reports.

- Click on the "Edit question" button.
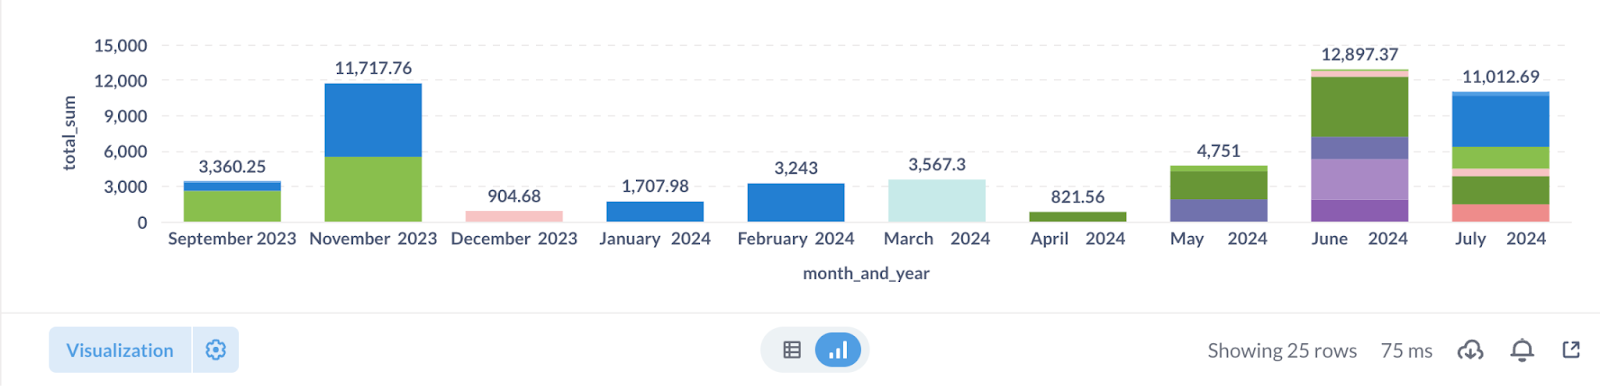
- Then click on the "Vizualization" button.
- Next, click on the view of your data visualization and select a color for each data view.
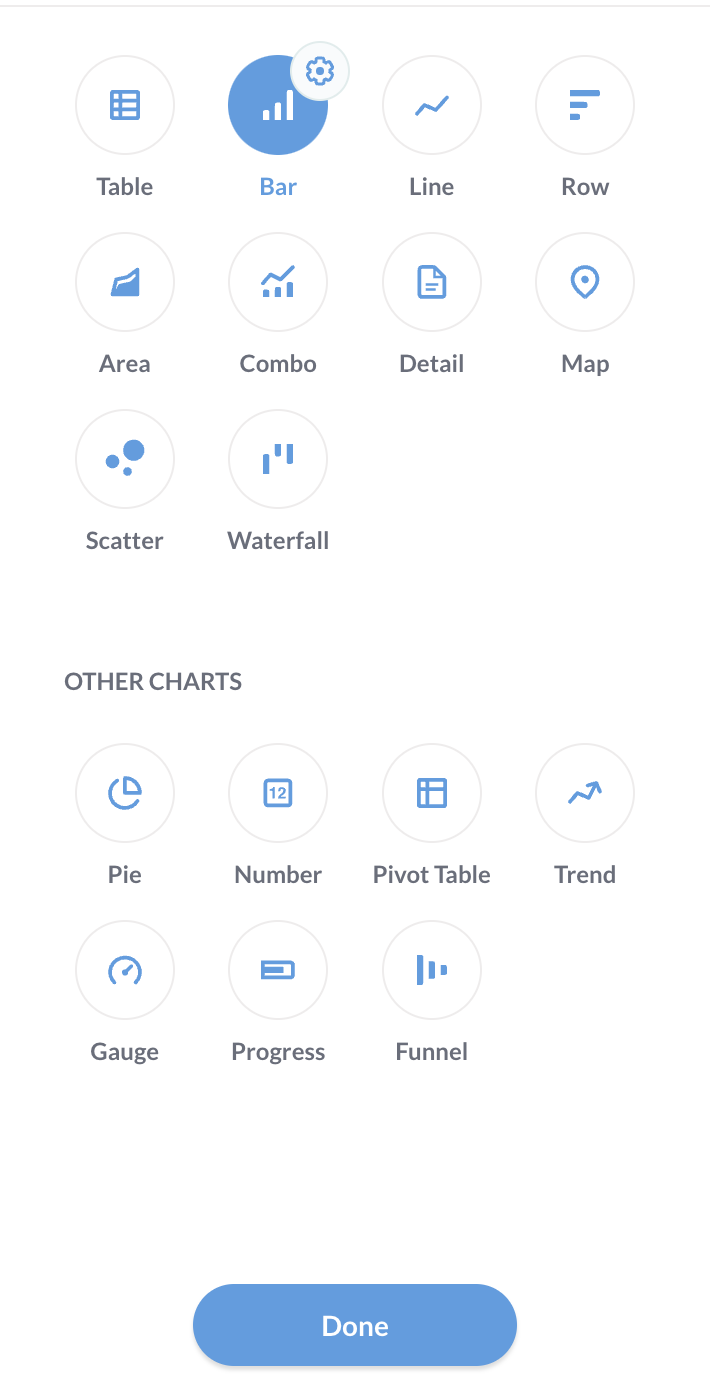
- Then click on the "Done" button and update the page.